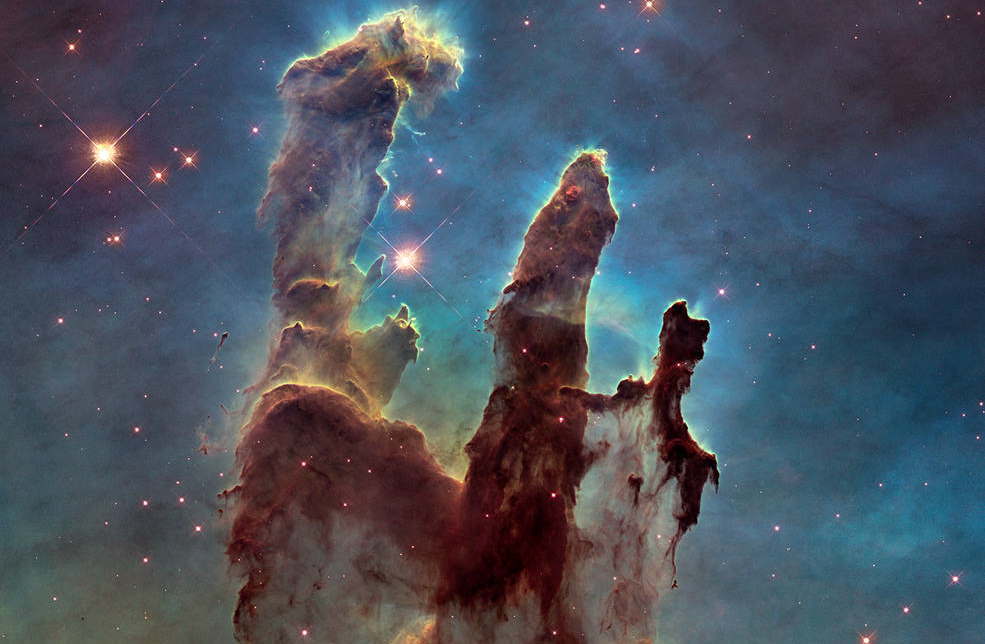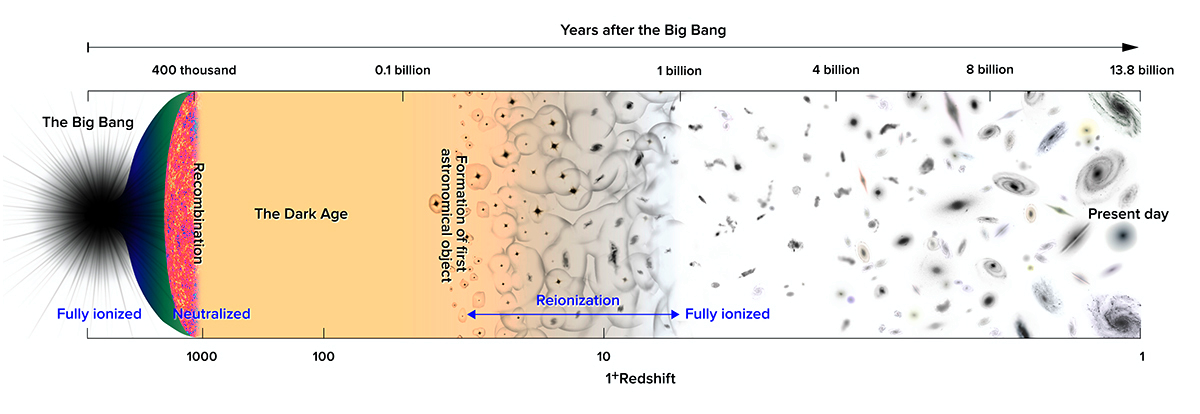
Looking back into history through redshift. The DESHIMA spectrometer is mainly interested in the reionization era of the universe. Image taken from [1]
Abstract
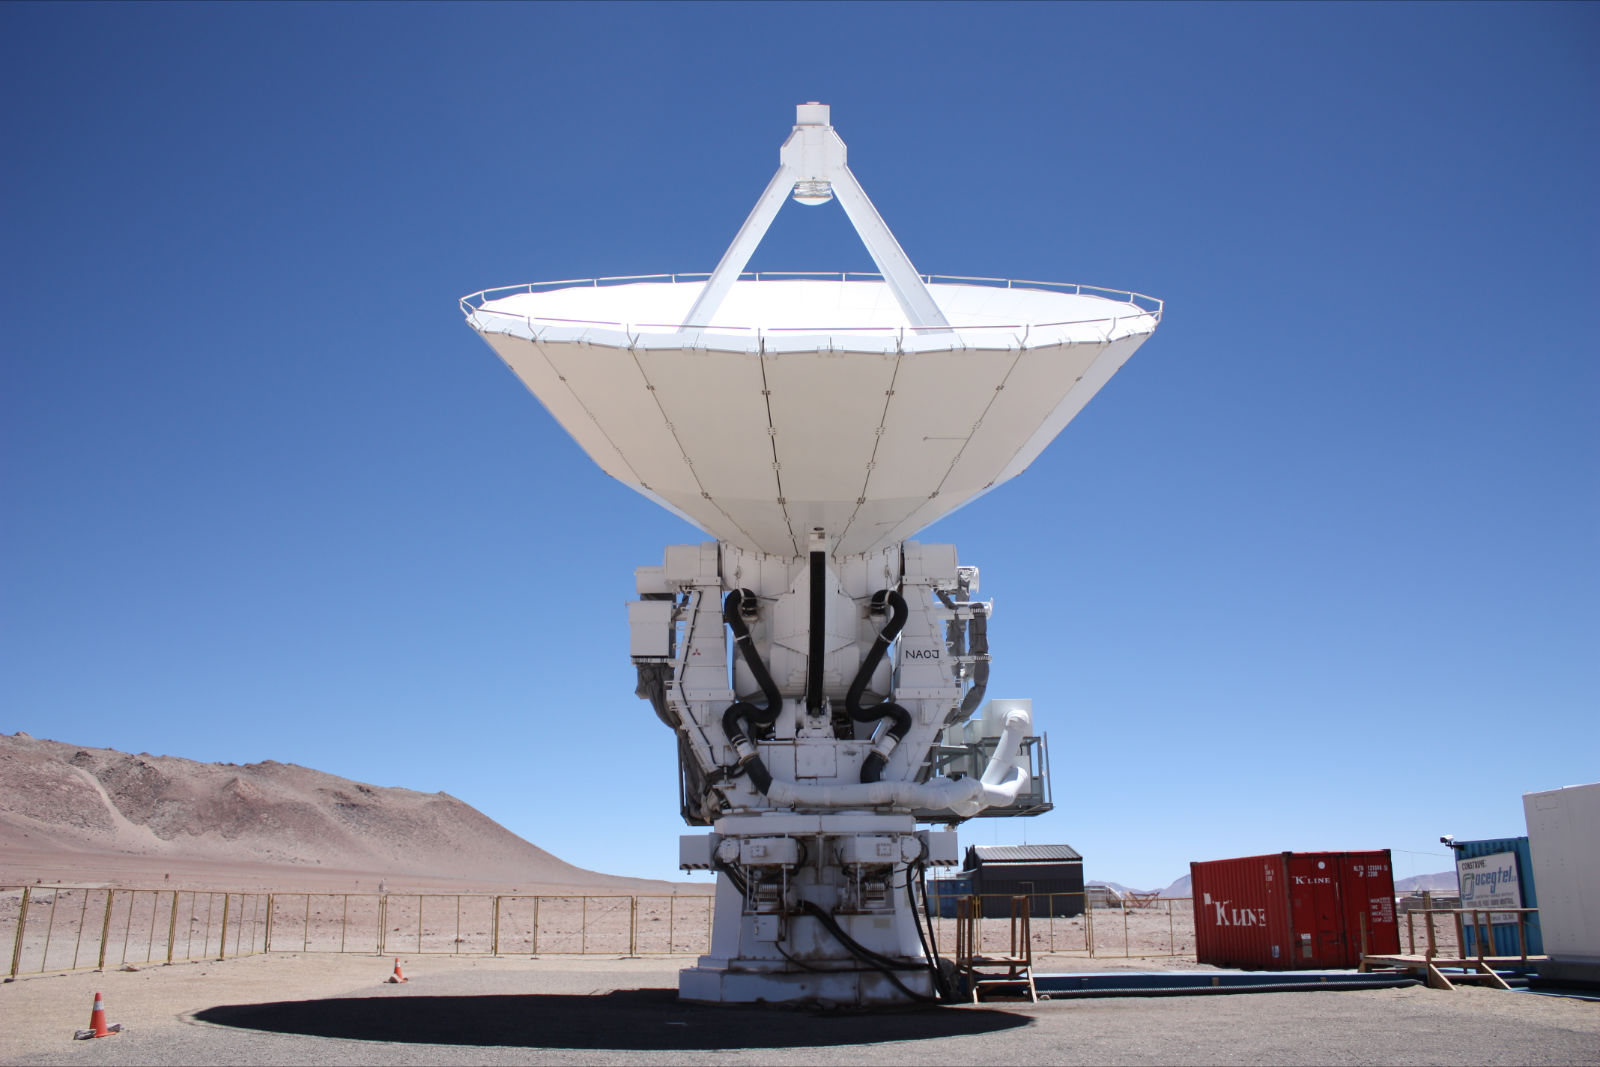
In order to investigate the forming of galaxies, astronomers look back in time using (sub)-mm observations. DESHIMA (the Deep Spectroscopic High-Redshift Mapper) is a 347 channel superconducting spectrometer with spectral resolution $R=\frac{\nu}{\Delta\nu}=500$ that operates in the range of $220\:\mathrm{GHz}$ to $440\:\mathrm{GHz}$ and can therefore accurately measure the frequency of spectral lines in order to calculate redshift $z$.
This report investigates the sensitivity of DESHIMA-like spectrometers by investigating photon noise due to Poisson and bunching effects. It gives a broad overview of photon statistics and explains, through an analogous model, that photon bunching occurs due to an underlying change in the probabilistics, rather than the act of detecting itself. After that I investigate photon and quasiparticle recombination noise for a DESHIMA-like spectrometer with Lorentzian filters and find a closed form equation for Noise Equivalent Power per channel for a constant power spectral density arriving at the filters.
where $\eta$ is $\pi/4$ times the peak hight of the Lorentzian, the average transmission over the $\mathrm{FWHM}$ of the Lorentzian. Previously the bandwidth of the filters was assumed to be negligible, resulting in an overestimation of the bunching. Because the photons that are impinging on the detector span a bigger bandwidth, the bunching is a factor of $\pi/2$ smaller than previously approximated.
This $\mathrm{NEP}_{\tau}$ is defined at an integration time of $\tau=0.5\:s$. For other integration times this is scalable through:
This will however only hold while the integration time is much bigger than the coherence time $\tau\gg t_\mathrm{coh}$. Because of the correlation between photons arriving shorter than a coherence time apart, the scaling of the $\mathrm{NEP}_{\tau}$ drops in cases when $\tau\not\gg t_\mathrm{coh}$.
Finally I propose and describe modifications to the sensitivity model DESHIMA uses. The following features have been be improved and added:
Integrate over the entire power spectrum when calculating photon noise
I use an integral expression for photon noise found in the literature and integrate over it using a Riemann sum to calculate the photon noise per channel. This improves accuracy, in particular in local extrema, for example at frequencies close to the emission lines of water and oxygen, where the loading of the side bands smooths out the $\mathrm{PSD}$ at the center frequency.
Use arbritatry filter designs loaded from a file
I design the modifications in such a way that an arbitrary filtershape can be loaded in and the sensitivity can be calculated from it. These can include lab measurement and simulations based on the full circuit model, both varying wildly from perfect Lorentzians. This enables a more robust estimation of the instrument performance on sky.
Improve estimations of the quantities that express sensitivity
Finally I will transform the calculated $\mathrm{NEP}$ to quantities like the noise equivalent flux density $\mathrm{(NEFD)}$ to show the sensitivity of the system in an astronomical measurement. This was previously done by approximating the $\mathrm{PSD}$ as flat over the filter channel, but I have improved on this by taking the entire range of the filter into account for both continuum and spectral sources separately. For calculating the sensitivity of line emissions the $\mathrm{NEP}$ can also be compared to frequency-integrated signal power at the detector, to be calculated separately.
I compare the proposed modifications to the old model, which has previously been compared with measurement results, and use it to validate the changes. Other than the previously mentioned factor of $\pi/2$ for the bunching term and the smoothing out in local extrema, the modified simulation results are similar to the old model. This is because the Lorentzian filters have a small bandwidth $\nu\gg\Delta\nu$, such that the previous narrowband approximation held for most non-extreme cases.
The figures in this thesis are interactive. That means that you can drag over an area to zoom as well as toggle traces on and off and hover over them to inspect the data.
- [1]D. R. Wilkins and S. J. Crass, “Institute of Astronomy,” ALMA detects the most distant oxygen ever | Institute of Astronomy. University of Cambridge, Jun-2016 [Online]. Available at: https://www.ast.cam.ac.uk/content/alma.detects.most.distant.oxygen.ever